
Infographics proliferate news and social media. Students must be able to understand and critically interpret them, and the skills involved in doing so do not differ much from the skills involved in close reading—comprehending words, making inferences, and drawing conclusions. The visual layout of infographics helps our brains ingest the information presented, but the structure and visual content of an infograph must also be analyzed. Because they are visual and need to be interpreted, infographics are fun to use in the classroom—a pictorial guessing game. Online sites like dailyinfographic.com and books like The Best American Infographics 2015 can be useful. Besides the fact that visual literacy is a skill on most standards lists, students like the break from verbal text.
A few years ago I realized that in addition to interpreting the infographics I supplied, students could create infographics themselves. As long as they have been exposed to several different types of infographics as examples, and they have a text to work with, they can generate their own. When I assign this, I give only a few parameters, since I want students to figure something out for themselves. These are:
-
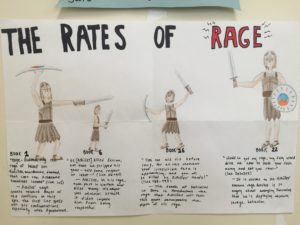
Student infographic measuring Achilles’ rage throughout the Iliad. Find something measurable or graph-able in the text. This could relate to a number of something, a chain of events, a theme, or something else. Ask yourself how it can be represented as an infographic.
- Create your infograph.
- Somewhere on the paper, or on the back if it doesn’t fit, include two cited quotations that relate to your infograph.
Students must comb through the text looking for measurable, visually representable information. With this exercise, ideas usually flow better in partners or small groups. There are infographic-generating sites, such as Piktochart, but I let students create with paper and markers if they choose. It might take a bit longer, but the kinesthetic aspect of drawing often helps students think.
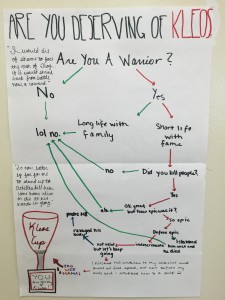
I am always impressed with the results. I usually assign this toward the end of our Iliad selections. The students produce infographics about who has the most glory, which god has the most influence in story, or how many times certain epithets are used. They make flow charts titled “Will you be remembered?” or “Which Iliad character are you?” and list a chain of events that will determine the reader’s fate. They draw “Rage-o-meters” and timelines featuring the path of a rolling golden apple. It is creative and text-based.
It is important to note that infographics are texts in their own right. Thus, students are not merely responding to comprehension questions; they are creating a new text which can be interpreted by a reader. This act of creating is an act of teaching. And, as everyone knows, teaching is the best way to learn.
Leave a Reply